
“There are three kinds of lies: lies, damned lies and statistics.” Disraeli? Mark Twain? (see here)
INTRODUCTION
This is Part II of a series about dealing with the covid-19 pandemic. Part I dealt with government folly, focusing on Pennsylvania. In this article, Part II, I want to give some statistics, discuss what they tell us, even though for the most part they are incomplete and/or misleading. That last statement pains me greatly. I’ve outgrown most of my mild Asberger’s syndrome, but I still want to believe (with Pythagoras?) that numbers represent reality faithfully.
Since the middle of March, I’ve been putting statistics from the Johns Hopkins world map and from the Pennsylvania Department of Health into a Numbers spreadsheet (the Mac equivalent of Excel) and playing with them, as follows:
- US “confirmed” cases, deaths, recovered cases;
- Pennsylvania confirmed cases, deaths;
- Montgomery county (Philadelphia suburb) cases, deaths;
- Montour county (rural, north-central PA) cases, deaths;
- S. Korea “confirmed” cases, deaths, recovery.
The locales were chosen to illustrate different environmental situations (and different ways of coping with covid-19).
Now, even though the values for the numbers from the sources do not represent reality faithfully, they may give a good representation of trends, how things are changing with time. That would require that the data be taken in a uniform way, so that if there is a bias, it remains the same for each data point and would thus tend to cancel out when differences are taken. To see how things change with time and thus determine a trend, I’ve taken daily differences (represented by “Δ(something)”) and differences of the daily differences (represented by “Δ(Δ(something)).” The daily difference is a measure of the rate of change (graphically: the slope of the plot, “speed,” or first derivative); the difference of the daily difference is a measure of how fast the increase rate is changing (graphically: the curvature of the plot, “acceleration,” or second derivative).
Now that the methodology has been explained (I hope), let’s look at the data.
WHAT THE NUMBERS TELL US (AND DON’T TELL US)
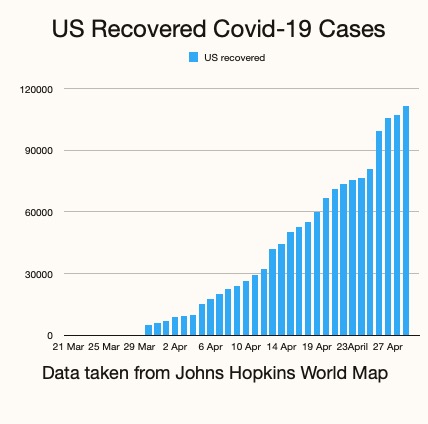
If you look at the featured image, number of US recoveries from covid-19, versus time, you’ll see a steady increase, going from about 5000 in the middle of March to a little less than 120,000 as of today (28 April). Well, as the Church Lady might say, “Isn’t that special!” Indeed it is, but given that just shy of a million cases for the US have been reported as of April 28th, it isn’t that encouraging—only about a 12% recovery rate.
But wait! Have all US covid-19 cases been reported? What about incidence of asymptomatic cases and cases where the symptoms were so mild that cases were never reported to a hospital? A study of antibody prevalence in Santa Clara County, California indicated that many more people have been infected with covid-19 than has been reported:
“These prevalence estimates represent a range between 48,000 and 81,000 people infected in Santa Clara County by early April, 50 (to) 85-fold more than the number of confirmed cases,” Erin benDavid et al, “Antibody Seroprevalence in Santa Clara County, California”
If 50-fold is an accurate estimate of the missed covid-19 cases, that would give about 50 million recovered from the virus. That number is clearly an over-estimate for the whole US. The population of Santa Clara County is about 2 million, so it’s densely populated (relative to flyover country). The infection prevalence is likely to be much higher there than where I live (only 47 reported cases out of the 18,000 county population). Even so, it’s evident that a large number of covid-19 infected have not been reported, so the “recovery numbers” represent a stratified sample. The trend is encouraging, but the absolute numbers are not meaningful.
There are other things that make me skeptical of the reliability of these statistics. In the World Map statistics I looked for data from my home county, Montour (PA). For four days running it reported an incidence of 54, while the PA Dept of Health gave 29. The discrepancy: Geisinger Medical Center, a tertiary care center in Montour County, takes in patients from a region containing several neighboring counties; some of the incidence data reported initially from Geisinger contained data that should have been attributed to these other neighboring counties; the error was corrected later, but evidently not taken into account by the World Map.
Here’s another: the CDC changed guidelines (around April 19th) for attributing deaths due to covid-19. Their guidelines suggested that deaths where covid-19 may have been a likely factor should be included in statistics, even though no test for covid-19 had been made. As a result deaths due to causes unrelated to covid-19 have been
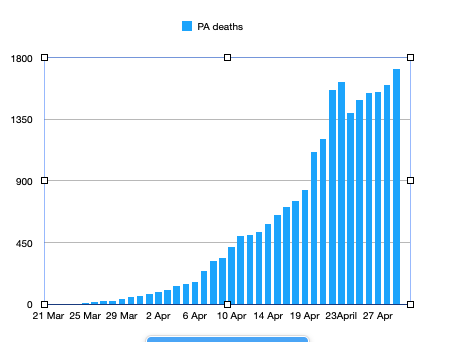
Data from PA Dept. of Health
included in the stats, for example drug overdose deaths in California. If you look at a graph of reported Pennsylvania deaths you’ll see this sharp spike when the reporting changes were made. You’ll see a similar behavior if you look at data for US deaths, NYC deaths, but not for deaths reported from other countries. So this jump is an artifact. There may be other reporting artifacts.
Looking at the number of confirmed cases or reported deaths one sees a weekly cycle. Numbers decrease on Saturday, Sunday and Monday and then jump again on Tuesday. Are the computers resting or are people not going to hospital on weekends? A similar cycle is seen for European countries, but not for Asian or Middle Eastern.
Now even though one may be skeptical about whether these stats give true numbers, they can still be used for comparison. For example, if I compare Montgomery county, a Philadelphia suburb, with my county, Montour, I find this ratio for cases: 4043/47 = 86. (The population ratio is only 46.) If I compare the fatality rate percentage for covid-19 (# of deaths/# of cases, %) for the US with that of S.Korea, I get 5.7% (and rising slightly) for the US, compared to 2.3% for S.Korea (approximately constant this last month). I’ll leave it to the reader to draw conclusions from these comparisons.
Here’s another comparison that’s of interest, the ratio of recovered / deaths. For the US, the present value (28 April) is about 3.2 and rising slightly. For South Korea, the value is 36 and approximately constant. For various European countries it ranges from less than 1 (UK) to about 20 (Germany).
Let’s take a look now at what insights can be gleaned from daily difference and double difference manipulations.
RATES OF CHANGE AND THEIR RATES OF CHANGE; SLOPES AND CURVATURE
Here’s what to look for in the difference (Δ) and double difference (Δ(Δ)) numbers. When the difference numbers start to decrease consistently it signifies that the rate of increase is slowing down, the curve is starting to flatten out. This is also shown by the double difference numbers: they become negative and increase in magnitude. Some of such decreases are seen on weekends only to start rising again on Tuesdays. Accordingly, a trend is indicated only if it lasts for at least a week. Here is an example for incidence of PA cases, given as a graph:
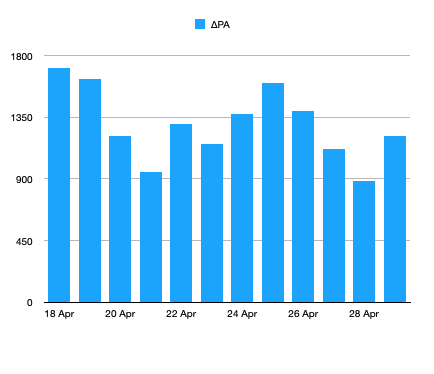
From PA Dept. of Health
You see a weekly cycle superimposed on a slight decrease in the difference. So one could conclude that the curve is flattening slightly, although another week of data would be nice to confirm that. If you look at the double difference for this data, it would appear to go randomly up and down about zero.
Most of the quantities that I’ve surveyed in this mini-study show a similar recent behavior: a slight decrease of the difference (rate) on which is superimposed a cyclic variation. I could do some heavy statistics, regression or time series fitting with linear and sinusoidal components, but the game isn’t worth the candle given the basic unreliability of the fundamental data.
FINAL THOUGHTS
I am less optimistic at this time about the ultimate value of this number crunching. By the time the data show long term trends one will be aware of them without needing a statistical confirmation. Well, it does help pass the time. Not as pleasurable as rereading Jane Austen and Trollope, or rewatching Gilbert and Sullivan productions, but more socially valuable?
NOTE
If any of you readers would like pdf copies of the spreadsheet on which this piece is based, please so indicate in a comment. Your email addresses are given as a prerequisite for commenting, so I’ll be able to email you the pdf file.


A question, please, from one who hates math and almost changed majors in college because the Poli Sci department required a course in social statistics for a degree (I talked the department head into letting me take pre-calculus trig instead): are there any of the various rates and ratios being pushed by the media that are of any real value in understanding what’s going on? Or should we just be looking at raw numbers, and trying to judge which ones are reasonably probative of something, given how much book-cooking seems to be going on by governments and their agencies?
Here’s another: the CDC changed guidelines (around April 19th) for attributing deaths due to covid-19. Their guidelines suggested that deaths where covid-19 may have been a likely factor should be included in statistics, even though no test for covid-19 had been made. As a result deaths due to causes unrelated to covid-19 have been included in the stats.
Bob:
1) How do you get from “may have been a likely factor” to “causes unrelated”? Seems like a huge jump there.
2) I’ve talked to 6 doctor friends in 3 states since the ‘false statistics’ meme arose last week and all told me there is no way there is any appreciable inflation of the actual deaths. For example, my radiologist friend in Boston said there is no need for a nasal or blood test when the imaging is so distinctive. My fellow parishioners said no one stands over them when they sign death certificates.
3) There is going to have to be a retrospective CDC estimate of COVID-19 deaths that were not cou/nted in the actual death. This is no different than what they do with the flu every year. It should be noted that most flu stats that are thrown around, such as the “up to 90,000 deaths in a bad flu year’ that Don quotes are estimates based on comparatively small actual numbers. So, may I ask, why the major concern with exact COVID counts and a lack of such concern with exact flu counts?
Don or Bob: I don’t know how my full name got posted with that comment, but if possible could you change it back to just “Frank?” If that’s not possible, no problem, I am retired and don’t have a job to worry about any more. 🙂
Tom, thanks for your comment. I’ll admit that saying “causes unrelated” was perhaps too strong. However, look at the link below where drug overdose deaths were included. . I’ve looked at the CDC directive as it’s been quoted on the PA Dept. of Health website and it does say “likely” without much other qualification. In other words, people tested positive for covid-19 but died of other serious conditions UNRELATED to covid-19.
By the way, I worked with radiologists and MD’s in a tertiary care facility, taught undergraduate premeds and graduate radiology interns, and I would trust only about 10% of them to make statistically valid inferences. (I apologize beforehand to MD’s reading this comment.) In any case, it may very well be the case that some deaths with other conditions should be included, but I doubt that all should. And that makes the data suspect, as indicated by the way it jumped for US, NYC, PA cases, whereas that for other countries did not.
Frank, as I said in the article, I don’t feel that raw data–cases or deaths–are useful. I think changes are useful in indicating trends, but because the sources are so unreliable, it is only comparisons or changes that give information.
Looking at the number of confirmed cases or reported deaths one sees a weekly cycle. Numbers decrease on Saturday, Sunday and Monday and then jump again on Tuesday. Are the computers resting or are people not going to hospital on weekends?
Saturday’s numbers represent Friday’s reports, Sunday, Saturday’s and Monday Sunday’s. The paper and pencil pushers are taking the weekend off. The numbers trickle in on Monday and get reported on Tuesday.
Thanks, Bob.
By the way, I worked with radiologists and MD’s in a tertiary care facility, taught undergraduate premeds and graduate radiology interns, and I would trust only about 10% of them to make statistically valid inferences.
Well, one of my doctor friends said emphatically that they understand statistics well enough to know if their hospital deaths numbers were being misreported, and so they know that’s not happening.
I read the drug addict article and the number of people affected is very small, correct? Also, frankly, the article doesn’t go into medical details, it’s really hearsay, and so I have to take it with a great amount of caution – it could well not be the entire story. We are into molehill territory here: one vague story that implies COVID numbers are being inflated doesn’t prove that they are, and we could have assumed an occasional misreporting has occurred without it.
Have all US covid-19 cases been reported?
Have all US covid-19 deaths been reported?
The answer to both questions is obviously “no”. Same is true of the flu, if you read the CDC disease burden site. So why the fixation on exact COVID deaths, and no such fixation on COVID infections or on flu deaths? As I’ve mentioned before, the “up to 90,000 deaths in a bad flu year” stat quoted here has only about a 5% chance of being true, the CDC’s current most likely estimate for the 2017-18 season is 61,000, and their average for the last 45 years is under 25,000.
Inflating covid-19 deaths isn’t rumor, it is policy. From the CDC:
COVID-19 should be reported on the death certificate for all decedents where the disease caused or is assumed to have caused or contributed to death. Certifiers should include as much detail as possible based on their knowledge of the case, medical records, laboratory testing, etc. If the decedent had other chronic conditions such as COPD or asthma that may have also contributed, these conditions can be reported in Part II. [Original emphasis]
In my experience, having dealt with death certificates for 38 years, influenza is often not put down on the death certificate. Usually the underlying condition, cancer, cope, etc. is.
The CDC recognizes that influenza usually is not listed:
It has been recognized for many years that influenza is infrequently listed on death certificates of persons who die with an influenza-related complication 1 and testing for influenza infections has been infrequent, particularly among the elderly, who are at greatest risk of serious complications from influenza. In addition, many influenza-associated deaths occur one or two weeks after the initial infection, either because of the development of secondary bacterial infections 3-5 or because influenza exacerbates chronic illnesses (e.g., congestive heart failure or chronic obstructive pulmonary disease) 6. These patients’ influenza diagnosis might have been missed because influenza tests are only likely to detect influenza if performed during the first 5 days after onset of illness when virus shedding is most likely to occur. Therefore, direct counting of a specific International Classification of Diseases (ICD) code for influenza on death certificates (the source of the National Center for Health Statistic counts to which you refer in your letter) likely substantially underestimates influenza-associated mortality.
https://aspe.hhs.gov/cdc-%E2%80%94-influenza-deaths-hhs-response-rfc
Covid-19, the Black Sniffles, is treated differently, for obvious reasons.
Yes, Don, obviously COVID-19 is being treated differently because it IS different. The biggest reason is that it is emergent, while flu generally is endemic, and so there is more accurate reporting on COVID-19, but other than that the same inexactness applies. There WILL be retrospective studies in the next few years that will raise the COVID-19 death estimates, using the same methodology as the flu estimates (as you quote), though not nearly as much because our COVID actual numbers are firmer than our flu numbers.
Don, didn’t you tell me back in March that you did not expect the U.S. COVID-19 deaths to reach 50,000, and if it did you were going to eat your words with some very imaginative condiments?
I expected more honesty Tom from our government and media. Foolish me.
Yes, Don, obviously COVID-19 is being treated differently because it IS different.
Quite right Tom. The only nasty flu bug ever to wreck our economy and cause our country to be treated like a nation of prison inmates. Not to mention all the political careers depending upon the public not waking up to what a destructive farce this has been. Yeah, it is very different indeed from the usual flu.
What dishonesty? The CDC’s policy on COVID-19 is merely doing what you yourself admit ought to be done with the flu death certificates. It attempts to do in the present what the CDC flu estimates do retrospectively.
The CDC’s policy on COVID-19 is merely doing what you yourself admit ought to be done with the flu death certificates
That is precisely not my position. My position is that the flu should not be on a death certificate when it is not the actual cause of death.
I’m sorry, I thought that extensive CDC quote you cited meant you would support adding flu as a cause of death to death certificates where it is currently left off.
I’m sorry, I thought that extensive CDC quote you cited meant you would support adding flu as a cause of death to death certificates where it is currently left off.
Nope, it was cited to show how the Flu is treated in practice and that the treatment of Covid-19 on death certificates is a departure from that practice, something noted currently by quite a few doctors.
Tom d., As I said in a comment, perhaps 10% of MD’s may understand how to use and interpret statistics critically. However my judgment is based on things like seeing posters for presentation with a regression line drawn through data points that picture shotgun hits against a barn wall. And I repeat: the sudden jump in deaths were noted immediately after the CDC change in evaluating cause of deaths. It was not seen in data from other countries. That in itself is evidence of an artifact; plus the complaints of coroners from Pennsylvania counties.
OK, but that doesn’t disprove that the COVID numbers are less accurate than the flu estimates, just the opposite. If COVID-19 is a likely contributor to heart failure (the patient having been confirmed as having COVID-19) but the virus is simply not the main cause of death, then that contributing cause is statistically stronger than the patient who died of heart failure and who is counted in the flu estimates based only on a statistical model.
TomD to use statistics in a meaningful way data has to be taken consistently; otherwise trends comparisons are meaningless if changes are made in the middle of a project. Any data set is a representation of what the population actually is. If the changed CDC guidelines had been followed from the beginning I would not have complained. But to change the criteria in such a way as to make the numbers bigger casts doubt on the legitimacy of the whole enterprise.
Let me add one other comment on the intellectual nature of MD’s. There are remarkably intelligent in following prescribed modes of inquiry, in amassing a great deal of factual information, in what I would call organic chemistry type intellection. But with some exceptions, they are not apt to “think outside the box.” With all due respect to your medical friend who knows statistics, I image he knows how to compute means of various kinds, set hypothesis tests, how to use programming, etc.. Whether he know when or whether to disregard confidence intervals or significance tests is another question. Which is not to cast any aspersions on his intellect–it’s just that the majority of MD’s in my 10 year experience working with them (at a first rate institution), don’t think in that way.
TomD to use statistics in a meaningful way data has to be taken consistently; otherwise trends comparisons are meaningless if changes are made in the middle of a project
C’mon Bob, you and I both know this is an ideal that often is impossible. The CDC itself has changed its flu estimation process twice in the past 50 years because it judged past methodologies as less accurate. That’s why statistics are often renormalized. I would submit that you are complaining about a similar improvement in methodology, and that real doubts about legitimacy reflect a non-medical consideration that would require a high level of proof, a level of proof that would have to surmount the counter-reasoning of every MD I’ve talked with.
TomD to use statistics in a meaningful way data has to be taken consistently; otherwise trends comparisons are meaningless if changes are made in the middle of a project
I don’t think that level of expertise is necessary to detect the kind of alleged fraud that some people believe is happening.
The CDC itself has changed its flu estimation process twice in the past 50 years Question, Tom: was this done in the middle of a flu season? If the answer is yes, then I’ll say your point might be taken. If the answer is no, then one has to worry about the motivation for making the change.
In the end (maybe a year from now), I predict we’ll find a huge # of people who had the virus and it was never known, but remember too that there may be many who died of the virus at home or elsewhere and it was also never known.
In 2009-2010 H1N1 (swine flu) spread to 60.8 million Americans with 12,469 deaths (0.02%). We already have >55k dead from covid in a couple of months. The covid death rate (%) will drop a lot as the denominator gets bigger, but I predict it’s still going to be HUGE as compared to other viruses.
but remember too that there may be many who died of the virus at home or elsewhere and it was also never known.
Very true, which is why the CDC will do retrospective estimates as they do with the flu. When they do my suspicions are 1) the gap between the real numbers and estimates will be smaller with COVID than with the flu and 2) the current focus on real number inaccuracies will turn out to be a tempest in a teacup.
Tom: was this done in the middle of a flu season? If the answer is yes, then I’ll say your point might be taken.
Bob, the estimation process begins in the current flu season but extends for several years afterward. The current flu disease burden document doesn’t even report on the 2019-20 flu season, and it plainly footnotes that the 2017-18 and 2018-19 seasons are subject to change. Assuming this is how the CDC has always operated, then it stands to reason that any attempt to improve the methodology will run afoul of your objection.
” then it stands to reason that any attempt to improve the methodology will run afoul of your objection.TomD, if you can’t understand why it’s important to have a consistent methodology for data collection during the course of a disease season in order to understand trends and to make valid comparisons, then I’m sorry, I can’t explain it to you. In any case the data is inadequate in enough other respects, as the Santa Clara study shows, that it useful only as a model, not as showing us what is really happening.
In 2009-2010 H1N1 (swine flu) spread to 60.8 million Americans with 12,469 deaths (0.02%). We already have >55k dead from covid in a couple of months. The covid death rate (%) will drop a lot as the denominator gets bigger, but I predict it’s still going to be HUGE as compared to other viruses
First, a word of caution Ben: that 60.8 million is the estimate of symptomatic cases. The CDC does not estimate asymptomatic flu cases on the reports I’ve seen.
Second, let’s use the 2017-18 flu season. If we go with the CDC’s best estimate (61,000 deaths / 42 million symptomatic cases) we get a ratio of 0.13. If we go with the CDC high estimate for that year (95,000 / 53 million) we get a ratio of 0.17. The COVID-19 numbers (59,266 / 1 million) gives a ratio of 5.93. Apply that COVID ratio to 50 million symptomatic cases and we get a shade under 3 million dead, right in line with the early March prospective estimates.
if you can’t understand why it’s important to have a consistent methodology for data collection during the course of a disease season in order to understand trends and to make valid comparisons, then I’m sorry, I can’t explain it to you.
Bob, I understand why it’s important. As I already wrote, that not the real world, and there are mathematical means of dealing with such transitions. Besides, the CDC methodology changed quite early, it was discussed around 25,000 cumulative deaths as I recall, and was implemented around 32,000 just a few days later. As time goes by it becomes less important. And are you sure the ‘likely’ deaths were not all added in? Doing so would affect daily rate changes for just a week or so if not properly renormalized by date,
Also, what is the point of your objection? If ‘likely’ COVID cases should be excluded, then ‘likely’ flu cases should also be excluded for any flu-COVID comparison, correct? Do that and the flu numbers have to go down by a factor of 40, which I don’t think is meaningful.
I’m sorry, when I wrote “And are you sure the ‘likely’ deaths were not all added in?” I meant “And are you sure the ‘likely’ deaths prior to the reporting change were not all added in?”
Going to Don’s point, this thing could kill like the Spanish flu…
and still be just the flu.
(And it doesn’t kill like the Spanish flu, btw)
Dr Scott Jensen in MN.in interviews has made a good case for COVID-19 cause of death on certificates being inflated.. Many doctors are not particular in filling out death certificates, e.g., if an auto accident victim is rushed to the ER; dies from trauma but is swabbed and is virus positive, cause of death is listed as COVID-19 not head injuries nor loss of blood. Also on a very busy night as much time may not be taken in filling the certificate out.
A COVID-19 diagnosis is big money for hospitals and putting a patient on a ventilator is even bigger money. Also the uninsured if they are diagnosed with the virus, their care is paid for by the government. Maybe at MEDICAID or MEDICARE prices, but still it is income. The point is once the feds started offering hospitals/doctors free money the reporting changed.
Johns Hopkins stats are being questioned now.
Italy is going back through the records they have and finding out that the primary cause of death was not the virus in many cases.
The point is once the feds started offering hospitals/doctors free money the reporting changed.
I say baloney. I asked a husband-wife pair of doctors in my parish about this. The husband doesn’t sign many certificates (I guess if I need his kind of surgery I’m seeing him), the wife said “No one stands over us when we assign cause of death and sign it” (BTW, she really dislikes liberals).There is no way allegations of substantial numbers of fraudulent ‘likely’ COVID deaths is going to stand scrutiny. No, the real ‘problem’ is the issue that Bob Kurland is pursuing here, that of the validity of counting bona fide ‘likelies’. As I said, when the CDC’s 2023 retrospective estimates come out, this is not going to be an issue.
Oops, should have written “Bob Kurland is mostly pursuing here”
A quarter century ago there was a rehab facility down South that wanted more customers, so they sent a few employees out to AA meetings and ‘befriended’ AA members, and then got them to drink, and then tried to get them to check in for rehab. So I would never say that there would never be a hospital which would be underhanded with COVID stats. but it would have to be very rare.