“O LORD, how long shall I cry, and thou wilt not hear! even cry out unto thee of violence, and thou wilt not save!”—Habakkuk 1:2 (KJV)
INTRODUCTION
Here’s one more “playing the numbers game.” (For others, see here, here, here , here and here.) On doing my daily inspection of the Pennsylvania Department of Health Statistics, I found their new display, a moving animation of cumulative cases by region and county. The computer jocks applied a rolling (moving) average of the data to smooth out irregularities and thereby showed trends that would have been less evident with the raw data.
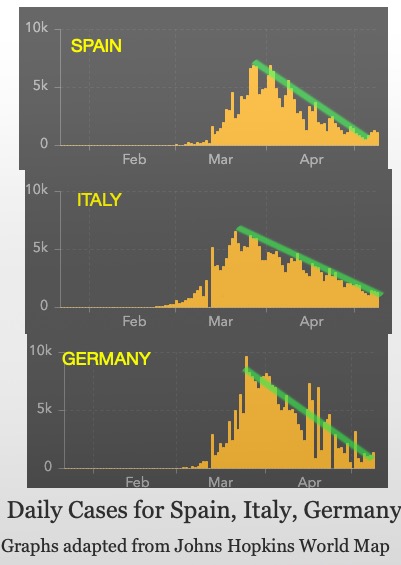
What a great idea, I thought. I’ll use moving averages on the data from the Johns Hopkins World Map and see if it gives a clue about when we’ll be done with this mess. After cases and deaths reach a maximum, they appear to decrease in a more or less linear manner. (See the featured image showing daily cases for Spain, Italy and Germany.)
EXAMPLES
If you draw a straight line (the green line) down this decrease, you can estimate from the slope of that line when the daily cases will diminish to a given value. The inferred slope is (roughly) an average decrease of daily cases per day. (One could do a linear regression on the data, but given the intrinsic inaccuracy of the data, that would be using a steamroller to crack a peanut.) Thereby, one gets the following numbers for Spain, Italy and Germany, respectively: -130, -100, -170 cases per day (“-” for the slope because it’s a decrease).
If the same technique is applied to the US daily cases, smoothed using a 7-day weighted average (weight is 7/28 for marked day, 6/28 for preceding day, 5/28 for two days preceding, etc.) you get the graph below: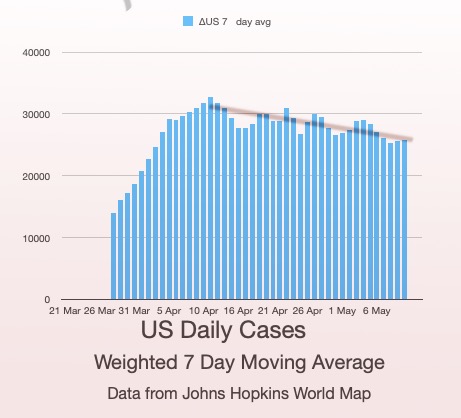
The slope is about -160 cases change per day, i.e. a decrease of 160 new cases per day.
The question is how to apply this number and, in fact, whether it makes any sense to use it. There’s evidence (Santa Clara County serological study) that the number of people infected with the Wuhan flu is underestimated by an order of magnitude or more. So, how meaningful is it to set an endpoint of, say 355 new cases per day, (that’s about 1 case per million population) if the true number of new cases is 7100?
ESTIMATING THE ENDPOINT
Perhaps a better estimate might be the daily death count. Even if those numbers have been inflated by the CDC (as Dr. Deborah Birx has suggested), they are now consistently applied day-by-day and thus can be compared with other mortality statistics. Accordingly, I’ve done the weighted moving average of the US daily deaths “attributed” to covid-19. The graph is shown below. 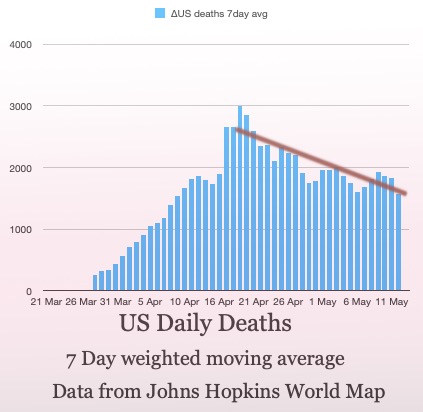 Again, the straight line to get the slope is drawn by eye, to get roughly as much deviation above as below. Note that even with the use of a moving average, there is a big jump around April 18th. On that date the CDC increased the kinds of conditions for deaths to be attributed to covid-19, but the decline had started before then, according to the graph.
This yields (a rough estimate) for the slope, -43. Or, the number of daily deaths due to covid-19 is decreasing by about 43 per day. So, what do we want to use for the endpoint? Before doing that, let’s see what the projected daily deaths would be 30 days from now:
1569 (12 May, moving average) -43×30=279 deaths/day 11 June.
Now let’s compare that number, 279 deaths per day, to deaths per day for other causes. (Data is taken from yearly deaths in 2017 due to various causes, “Medical News Today.”) The graph below shows daily death rates (annual/365) due to heart disease, cancer, accidents, CLRD (chronic lower respiratory disease), stroke and CVD (cerebral-vascular disease), Alzheimer’s, diabetes, flu and pneumonia, kidney disease, suicide. 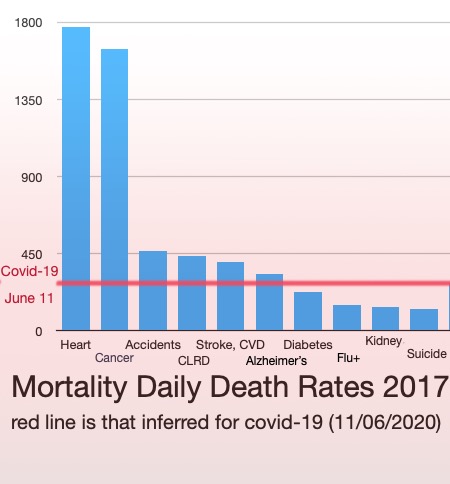 The horizontal line is the projected daily death rate due to covid-19 as of June 11th.
Well, if these numbers aren’t just pie-in-the-sky fabrications, we can learn something: by the middle of June daily deaths due to covid-19 in the US are going to be less than those for Alzheimer’s, stroke, CLRD (chronic lower respiratory disease), accidents, cancer and heart disease. And that will be for the US as a whole. The covid-19 deaths may be greater in metropolitan areas—New York, Philadelphia, Chicago, Detroit, Los Angeles—but they’ll be considerably less in flyover country.
WAS LOCKDOWN NECESSARY?
That’s a hard question for me to answer. We can do comparisons for European, Asian, South American countries, but there are so many confounding factors—climate, ethnic susceptibility to covid-19, metropolitan crowding, demographics—that it is hard to pick out what mitigation has actually accomplished.
And then there is, of course, the efficacy of prayer.


I posted this article under the nursing home debacle thread, but I offer it up here as well. It is out of the UK. The author suggests this virus has a penchant for crowds, nursing homes, hospitals, shut-ins, etc, and the young and healthy need to be out doing there thing.
.
https://www.spectator.co.uk/article/we-know-everything-and-nothing-about-covid
Thanks DJH; we subscribe to The Spectator and have read that…it’s a good one.
The lock downs may desist after 47 million American families are added to the rolls of the desperate destitute.
Starving people are more easily controlled.
T. Shaw is probably more right than he knows.
My guess is if you’re trying to test your way out of this, your economy is going to die before the virus runs out of people to infect.
One more math thought. I’ve approximated the triangle shape of the daily deaths: 100 days width, 3000 deaths/day max to get a total of 150,000 deaths in 2020 from the Wuhan flu. (My good lady wants me to call it that, rather than covid-19.) That’s less than heart disease, cancer, accidents, chronic lower respiratory disease; about the same as stroke; and more than alzheimer’s, diabetes, ….For what it’s worth…
Dr. Kurland. I’m not a math person, unless we are talking one equation, one unknown. (Maybe two equations if I’m allowed to substitute).
.
Does what you have noted above match with what that Israeli mathematician said a few weeks back? That according to his calculations, the WuFlu runs its course after about 70 days (peaking in about 40 days, dying out by 70.) Are you seeing roughly the same thing?
DJH, you and my good lady have that in common, except she won’t do any equation more complicated than x+2= 4, what is x? Nevertheless, she got the idea I was trying to get across from the last graph showing the daily deaths due to various causes and red line representing daily death (as of June 11), lower than heart disease, cancer, accidents, CLRD, stroke, and about the same as Alzheimer’s. If you trust my math (and that I’m not cooking the books), then that’s all I’d like you to chew over.
150k fatalities is fewer than the population adjusted 164k killed by the the Woodstock (I.e. Hong Kong) flu of 68-69.
So it’s still just the flu.
(Well, a flu.)
Ernst, 150k is a rough estimate–could be 180k or 120k. But your point is well taken, that it’s very like not going to be much worse that the Hong Kong flu. (for which no extreme measures were taken.)
that—>than