“Pennsylvania is Philadelphia and Pittsburgh with Alabama in between” attributed to James Carville
INTRODUCTION
“Inquiring minds want to know,” and my mind is nothing if not inquiring. So, when I read in a blog that 60% of all covid-19 deaths are in nursing homes, I wonder, “where does that number come from?” I do a web search and find an article reporting 42% of covid-19 deaths nationwide are in nursing and assisted living homes. Looking over the spreadsheet linked in the article, I see that the reported percentages of covid-19 deaths in Nursing and Assisted Living facilities range from 13.8 (New York!!) to 77 (Rhode Island), with my own state, Pennsylvania reported as 69.2. The statistics there don’t consistently agree with news reports of increased deaths that occur when Governors in blue states send covid-19 patients to nursing homes. But then, whom do you believe: statistics or the media? (It’s a hard choice!)
So I began to ponder: “what are some essential correlates (not causes!) of covid-19 infection and death for counties in my state, Pennsylvania?” And come up with the following:
- population density;
- age (according to reasonably reliable statistics, 57% of the covid-19 hospitalized cases in PA are over 65);
- number of nursing homes (anecdotal, news sources and above link);
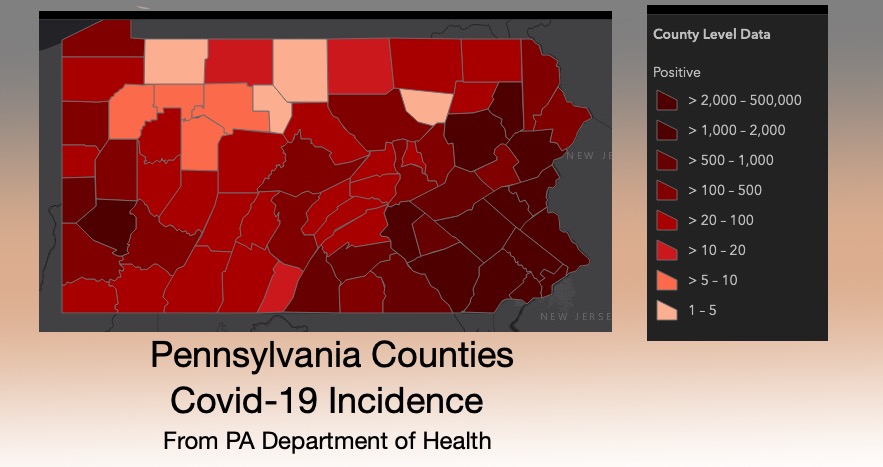
- nearness to “hot spots” (the featured image shows how incidence increases the closer a county is to Philadelphia).
I can think of others—median income, ethnic and racial composition, availability of medical care—but decided after looking at available data, not to include these last; data was missing for many counties and I was too lazy to pursue all possible sources of information. In any case these last factors are correlated with those in the bulleted list so they are implicitly acknowledged.
HOW TO FIND VARIABLES: FACTOR ANALYSIS
Four variables were listed above (and there could be more). However, there is a problem determining how these variables influence covid-19 death rates. One can’t use conventional multiple regression techniques because the variables aren’t independent. That’s evident just on the face of it, and also shown from correlation coefficients. What’s the solution? A statistical technique called “factor analysis,” can be used to find combinations of variables that are independent. And, fortunately for me, there is free online software¹ to do the factor analysis.
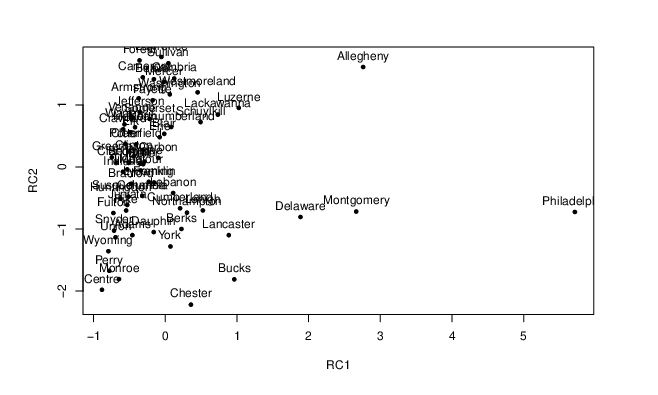
So, for the 68 Pennsylvania counties, I tossed the values for these four variable into the software pot, punched the “calculate” button and in 1 second got the following result for the two dominant factors:
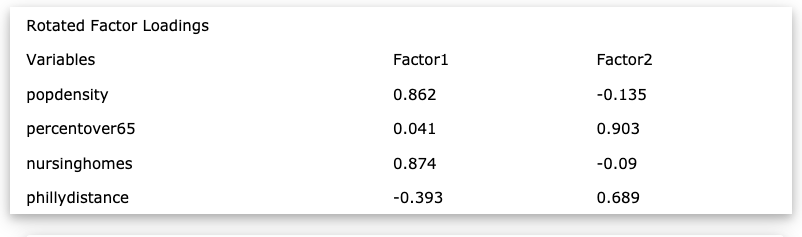
The weights of the original four variables in the two factor coordinates is given in the table below
Note that population density and number of nursing homes are the principal contributors to RC1, the factor that distinguishes Philadelphia and its bedroom counties from the other Pennsylvania counties (except Allegheny).
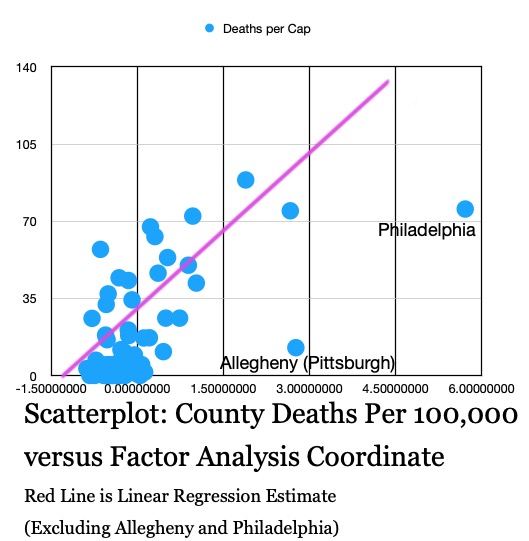 So, does this factor, RC1, correlate with covid-19 death rates? Apparently so, if the scatterplot and regression line to the right are an indicator (the horizontal axis is the value of RC1).
FINAL THOUGHTS²
Well, is this all just using a steamroller to crack a peanut? Isn’t Carville’s observation sufficient to show that there are two Pennsylvanias? Perhaps it is just another numbers game, but I think there is some useful output.
For example, the Factor Analysis demonstrates that both population density and nursing home number are factors in the covid-19 death rate, whereas age is not such an important factor. And certainly distance from hotspots plays a part (Philadelphia in particular) We can’t change population density or geography, but certainly nursing homes can be regulated. Also, it’s one more demonstration (as is the featured image) of which counties do not require severe mitigation conditions.
Could such an analysis be applied to other states? Is New York NYC, Albany and Buffalo, with Vermont in between? Is Illinois Cook county, with Kentucky and Indiana elsewhere? In other words, let’s distinguish between flyover country and the large metropolitan areas. The division is not only geographical, but one with many other essential characteristics.
NOTES
¹Wessa P. (2017), Factor Analysis (v1.0.4) in Free Statistics Software (v1.2.1), Office for Research Development and Education.
²If you’d like to see the raw data, sources and/or output from factor analysis program, please let me know in a comment. I’ll email them to you.


For additional analysis of Covid-19 deaths see William Briggs who has a Phd. in statistics and most importantly is honest and humorous
Coronavirus Update XV: The Curse Of Karen
by Briggs Posted on May 26, 2020
https://wmbriggs.com/post/30985/
.
New York changed their reporting standards so that they’re only publishing deaths that occurred physically inside the nursing home as nursing home deaths.
https://www.lifenews.com/2020/05/26/andrew-cuomo-sent-more-than-4500-coronavirus-patients-into-nursing-homes-killing-thousands/
Nice work! Second the Briggs recommendation.
As always in this situation, definitions get to be very difficult. In this case, what qualifies as a nursing home, and what qualifies as a nursing home death? Some areas have pretty good hospice care – two of my older sisters died “at home“ when released from a nursing home into hospice care once their deaths were immanent. Nursing home deaths, or not? If their area had not had good hospice care options, maybe they would have died in a nursing home. This is just one example of thousand nursing home deaths, or not? If their area had not had good hospice care options, maybe they would have died in a nursing home. This is just one example of many that spring nimbly to mind when trying to understand not just the aggregated data that’s reported breathlessly, but what goes into the aggregated data. The devil is in the details.
Briggs seems a gem. I like his “assorted Nitwitery.” I thought it as his comments section.
Money quote [paraphrased]: Models can only report what they are told (inputs, estimates, forecasts, and assorted fake stuff) to conclude.
Edit Orwell, In a time of universal nitwitery, resort to the rational is a revolutionary act.
Really great stuff, Bob.
Thanks for the comments, folks. I too realize the data are flawed, especially if one’s source is the internet. But if all the data for a given variable are from the same source, then a bias is likely to be applied consistently, so one can make comparisons and maybe see what are likely trends. At least, that’s how I like to play the numbers game. Oh, and I’ll third the recommendation for Briggs’ website.
Nursing Homes: warehouses for the aged and dying. Useful and justified for a few. It wasn’t so long ago when the old lived our their years with their families. Now most are considered a burden to be cared for by strangers.